
What is streaming telemetry?
Ensuring network uptime requires insights into the performance of the devices in the network. Traditional methods of collecting network telemetry data include ‘pull’-based mechanisms such as the SNMP protocol, CLI show commands, and syslog messages. All of these have inefficiencies that inhibit a network engineer’s ability to plan, deploy, and assure services.
We are now seeing the emergence of a different mechanism for collecting network performance data: streaming telemetry, a push-based mechanism that overcomes the weaknesses of SNMP polling and other data collection means. Following is a primer on what streaming telemetry entails.
Limitations of SNMP-based network monitoring
This list of the shortcomings of the traditional collection methods helps highlight why streaming telemetry is becoming more popular. Every network monitoring system primarily uses SNMP for collecting a wide variety of device performance metrics. The most common metrics are availability, throughput, utilization, delay, and errors; these are collected for devices, interfaces, links, memory, and CPUs.
SNMP consists of the Management Information Base (MIB), where management information is stored in a hierarchical structure with different branches. These are represented by an identifying number and string, together known as Object Identifier (OID). The MIBs are standardized, but vendor-specific definitions are also allowed.
When vendors add their own fields for a new metric, a third-party network management tool will need to be updated to read and process the new OID. This is easy to do in small and medium-sized networks. However, doing the same in large networks—such as service providers with thousands of multi-vendor devices—is demanding.
Following are the other limitations with using a pull-based technology such as SNMP.
Lack of useful data
The information these methods collect about the current state of the network and certain performance metrics is incomplete. Under a pull-based mechanism, the devices send data only when requested by a client, thus requiring manual intervention for selecting devices and metrics to poll, setting polling intervals, etc.
When using SNMP, for instance, changes that occur between a polling interval are discovered only after the next polling. In large networks, the polling interval can be as long as five minutes, which is unacceptable when hundreds or thousands of events can occur in the interim.
Additionally, SNMP does not collect all information regarding a device or its current performance. Some information is not stored in the MIB and is accessible only using CLI commands, or is not available at all.
For example, neither SNMP nor using CLI can collect historical routing information. This leaves a visibility gap into routing changes in the network, unless the network operator owns a route analytics tool.
Scaling inadequacies
Scaling issues occur due to the load on a Network Management System (NMS) used in large networks. This can be quite high due to the sheer number of devices it has to poll and the volume of data it has to process. Additionally, the CPU and memory load on a network device parsing numerous SNMP requests can be excessive, especially when multiple NMSs are used.
Security Issues
Polling-based techniques also add to security issues, as the NMS needs the list of devices to poll, as well as each device’s IP address and security credentials.
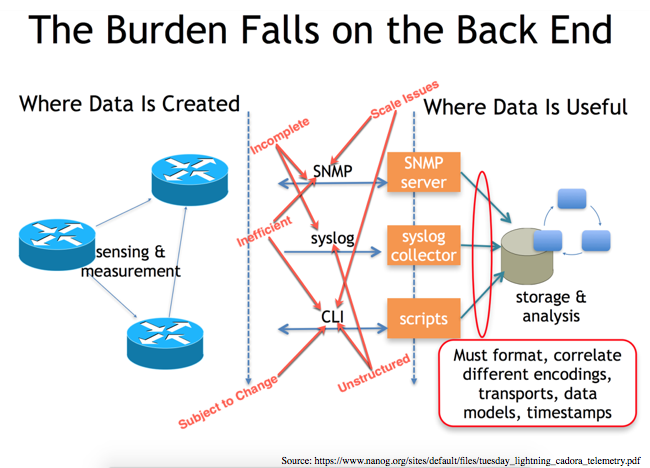
The image below summarizes the limitations of data collection via SNMP, syslog messages, and CLI. An NMS that uses these data sources should be able to provide meaningful information by formatting, processing, and correlating the mix of data in different formats, from various sources.
Unfortunately, most don’t.
What is streaming telemetry?
Streaming telemetry is a push-based mechanism that removes the inefficiencies associated with polling. The required data is streamed automatically and continuously from network devices to management systems, without the need for any polling. The network device is configured with the type of data to be collected, the frequency of collection, and where it should be sent.
Streaming telemetry enables access to real-time, model-driven, and analytics-ready data that can help with network automation, traffic optimization, and preventive troubleshooting. For example, streaming telemetry can report in real time on packet drops or high utilization on links. This information can then be used by a network automation platform to provision new paths and optimize the traffic across the network.
With streaming telemetry, the telemetry data is described using YANG, a structured data modelling language, encoded in JSON, XML, or using Google Protocol Buffers, and is then streamed over TCP, UDP, or gRPC.
Cisco has covered the basics of two methods for streaming telemetry data here:
https://www.cisco.com/c/en/us/td/docs/iosxr/ncs5500/telemetry/b-telemetry-cg-ncs5500-62x.html
Even more reasons streaming telemetry is a better choice than SNMP polling: http://blog.ipspace.net/2018/03/streaming-telemetry-view-from-trenches.html
Ready for streaming telemetry? Blue Planet Route Optimization and Assurance (ROA) supports streaming telemetry. To know more about ROA, request a personalized demo.
This content was originally published on the Packet Design blog and has been updated since the acquisition by Blue Planet.