
When the lights go out: How utilities can better assess the impact of outages on their network assets
Yet as we enter the peak of summer heat in August, additional power outages continued to plague NYC this summer. A little over a week after the Manhattan blackout, 50,000 customers in Brooklyn and Queens lost their power as the temperature rose to above 90 degrees amid a brutal heat wave. “More than 30,000 customers had their juice deliberately cut by the utility thereby avoiding a much longer outage,” Con Ed spokesperson Allen Drury told Curbed at the time. Curbed also indicated that Con Ed had identified a ‘flawed connection’ as the cause of Manhattan’s major blackout.
As these power outages occur, and with more frequency lately, the first question to staff from utility management is: what resources, facilities and customers have been impacted by the outage?
The resources underpinning utility networks
In the world of Operational Technology/Information Technology (OT/IT) networking, how can utilities answer this question if they do not have a complete understanding of the resources underpinning their networks? To effectively manage their networks at the most basic level, utilities need an inventory system that accurately presents all available resources, both physical and virtual, end-to-end.
Why is it a challenge to get this view? Well to start, within a utility, three interconnected network and OT/IT processes are integral to business operations:
- Plan-to-Build—Creation of the OT/IT resource-ready network that can support new OT/IT facilities, including physical, logical, and virtual infrastructure
- Order-to-Facility—Taking an OT/IT facility request and converting it into a facility via available network resources and applications
- Trouble-to-Resolve—Proactive monitoring of the facilities to handle events and faults and restore OT/IT facilities to a normal state
There is also data associated with the state of OT/IT facilities. This data exists for multiple domains (such as substation WAN and core) and network layers (such as optical, Ethernet or IP). It is not uncommon for large utilities to have dozens of different inventory systems, either vendor supplied or internally developed.
Utilities’ OSSs must become more in sync with the live state of their managed networks. A static, inaccurate view of resources leads to a breakdown of the mission-critical processes that span OT/IT and the network.
Utilities have steadily built overlay network infrastructure and Operational Support Systems (OSSs) to meet each new resource demand. Moreover, these legacy inventory systems are static and are not informed by real-time network information. But today, as virtualization technologies are introduced alongside traditional, hardware-based infrastructure, utilities’ OSSs must become more in sync with the live state of their managed networks. A static, inaccurate view of resources leads to a breakdown of the mission-critical processes that span OT/IT and the network.
What has been impacted during an outage?
When outages occur in the power grid, how does front line staff answer the question from management about what resources, facilities and customers have been impacted? Today, multiple assurance systems currently exist per network domain and per layer. These present real-time performance metrics, but the problem? These metrics are not correlated, making it difficult to determine how issues in one domain or layer impact end-to-end facilities and to troubleshoot the root cause of issues. So when trying to understand the impact from an outage, utility staff typically must scramble to gather data across these multiple assurance systems to deliver an accurate view.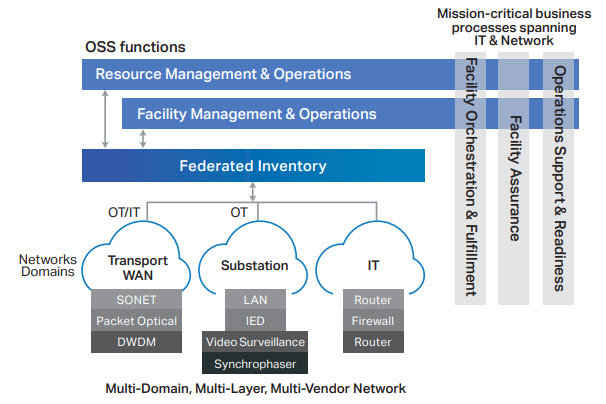
Figure 1: Inventory is at the heart of OSS business operations
Blueprint for success—Blue Planet® Inventory
Both OT and IT groups have a catalog of applications that span any mix of network domains. To solve this problem, operations personnel need to be able access multiple, per-domain inventory and monitoring systems at once to complete resource planning, fulfillment and assurance tasks. This is where Blue Planet Inventory (BPI) can help, it synchronizes this per-domain information and correlates real-time network data to present a single, accurate view of network resources.
This gives utilities the ability to create OT/IT resources that combine any domain resource and manage the full lifecycle of operations for that resource — including troubleshooting and SLA monitoring—across multiple vendors and any hybrid physical and virtual network infrastructure. By abstracting the complexity of the underlying multi-domain infrastructure; BPI, the winner of UTC’s Impact Award for software in 2019, greatly accelerates and simplifies business operations that rely on both OT/IT systems and the network.
Laying the dynamic inventory foundation
The first step to achieving this holistic network asset management involves the federation of multiple per-domain, per-layer inventory systems, along with reconciliation of real-time network data to create a single, dynamic view of all network resources. The BPI approach allows utilities to leave their existing multi-vendor system investments in place while introducing a ‘single pane of glass’ with a user-friendly, next-generation interface.
Innovative visualization of end-to-end network and facility views dramatically improves the ability to troubleshoot network issues and accelerate network planning and design processes. Furthermore, many tasks that were extremely tedious and error-prone can now be automated due to Blue Planet’s open APIs, which allow for simple integration to adjacent OSSs.
As utilities face continued pressures on the grid due to heatwaves like we saw back in July, outages will occur - whether due to grid faults or proactively to avoid larger power outages. When this happens, what is needed to answer the system impact question from management is federation of multiple inventory sources and synchronization of planned and real-time data, to obtain an accurate view of a multi-vendor network and its resources (without creating yet another system or database).
BPI is a flexible software platform that federates data from utilities’ multiple legacy OSS, reconciles it with real-time network data, and presents it in a single dynamic view that reflects the current state of network and service resources from end-to-end. The dynamic visibility provided by BPI helps utilities simplify and optimize key operational processes.
With new confidence in the underlying inventory integrity, sophisticated analytics and policy control can be used to inform and automate plan-to-build, order-to-facility and trouble-to-resolve workflows. The net result: an elevated OT/IT user experience and better utilization of network investments.