
Evaluating how your network operations stack up: 3 steps to driving efficient operations with dynamic inventory
How efficient are your operations in supporting the delivery of new dynamic services like 5G, network slicing, edge cloud, and next-gen residential broadband? I’m excited to introduce Blue Planet’s new Dynamic Inventory Value Calculator which helps CSPs quantify the potential business value of dynamic inventory to their business in three simple steps.
One of the biggest challenges I see when working with our Communications Service Providers (CSP) customers is helping them quantify the business value that will fuel their OSS modernization. As CSPs look to implement next-gen networks and services to support new customer experience and revenue objectives, they quickly realize that their inventory systems just can’t measure up.
Despite a clear need for a more modern, dynamic approach to inventory, many service providers find it challenging to move forward because of the difficulty in demonstrating how accurate data can drive operational cost savings and business value for the company.
Not having an accurate view of the “what and where” of the network makes automation and reduced human intervention all but impossible
- Appledore, Blue Planet Inventory: Enabling Automation with Dynamic, Federated Inventory, Dec 2022
To address this challenge, Blue Planet has developed an easy-to-use Calculator to help CSPs quantify the potential business value of dynamic inventory to their business.
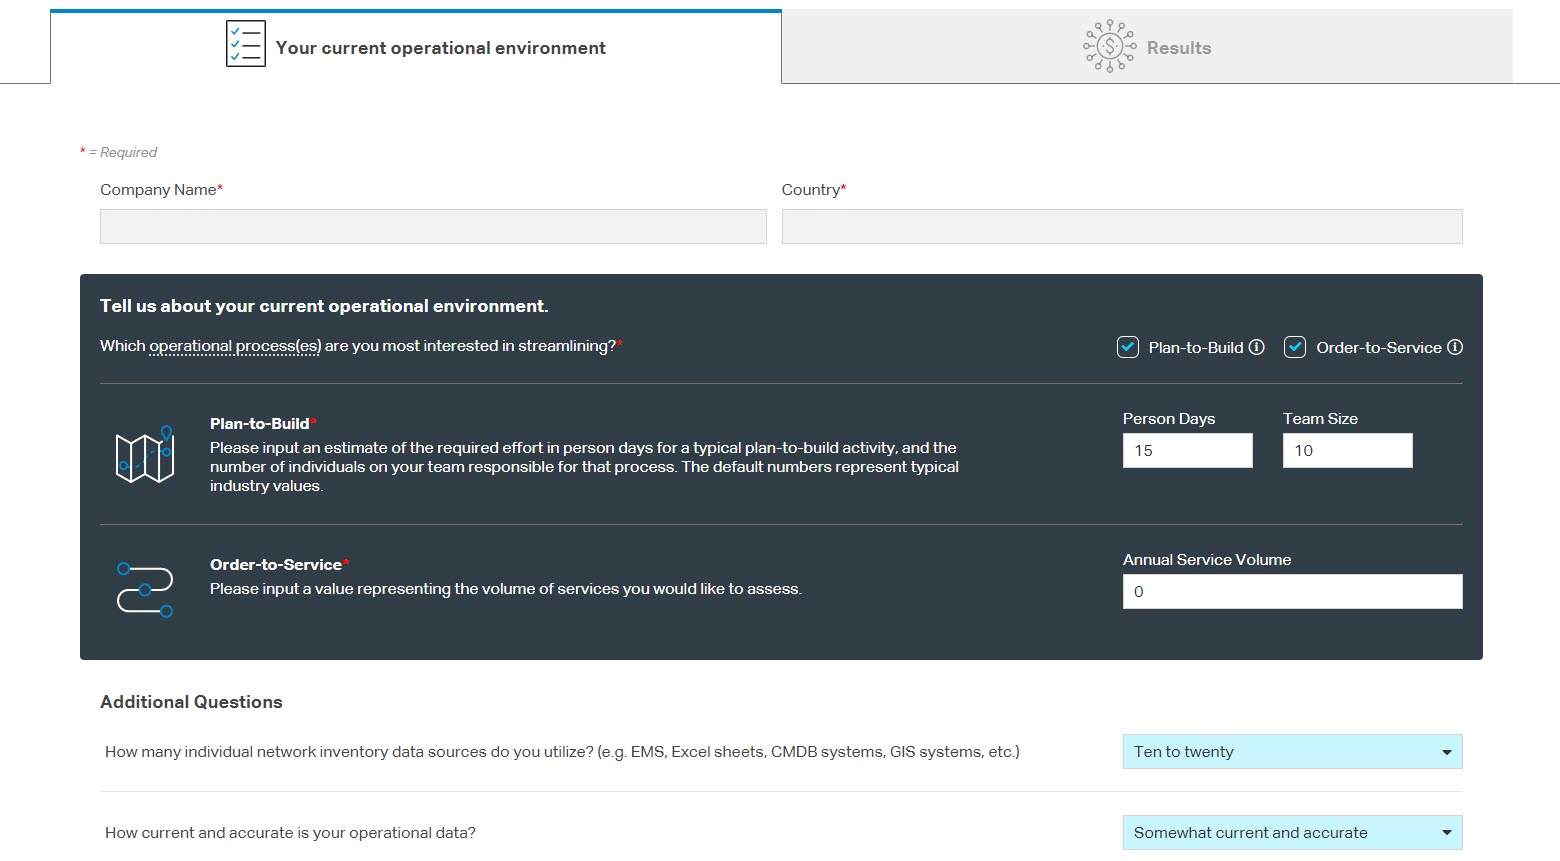
Figure 1. Blue Planet Dynamic Inventory Calculator
Our Calculator assesses potential operational cost savings based on a mix of industry benchmark values and inputs about CSP’s current state of operations using the following three steps:
Step 1. Determining which operational process(es) you want to evaluate
Consider where inventory modernization can have the greatest impact in your organization. Traditionally, inventory modernization has been viewed in the context of facilitating the plan-to-build process – activities such as visualizing existing resources and planning and designing both existing and new infrastructure. At the same time, accurate inventory plays a valuable role in streamlining and automating the order-to-service process in terms of reducing order fall-out rates and improving time to market. Our calculator gives the option of estimating potential cost savings for one or both processes.
 Step 2. Assessing current state of operations
Network design and operations teams typically manually correlate network inventory data by “swivel-chairing” between multiple systems in each domain. As a result, end-to-end service creation and activation is excruciatingly slow and error-prone.
This step in the evaluation involves looking at your current state of operations in terms of hours and costs associated with each operational process to estimate where potential savings could be realized. With respect to the plan-to-build process, metrics captured by our Calculator include labor charges, number of person-days, and team size required to complete an average number of activities each year. Calculations relating to the order-to-service process are based on service volume and a blend of consumer and enterprise service characteristics to provide insights applicable across a broad range of use cases in the industry.
Step 3. Reviewing results and operational impact
Finally in step three, potential operational cost savings are presented in the context of the metrics captured in step two and process improvements seen by Blue Planet across the industry. Results can be viewed immediately, and a customized report with additional details of the analysis will be sent.
A dynamic approach to inventory is critical to OSS modernization as it streamlines and drives automation across operations. CSPs can consider how potential savings from using Blue Planet Inventory can contribute to meeting business objectives and supporting next-gen service delivery.